
What are some practical tips for adapting to rising sea levels in Sydney?
Rising Sea Levels in Sydney: What do the Measurements Show?
In recent years, the issue of rising sea levels has become a major concern for coastal cities around the world, including Sydney. As global temperatures continue to rise due to climate change, the melting of polar ice caps and glaciers is causing sea levels to increase at an alarming rate. But what do the actual measurements show when it comes to rising sea levels in Sydney?
Understanding Sea Level Rise in Sydney
Sydney, being a coastal city, is particularly vulnerable to the impacts of rising sea levels. According to data from the New South Wales Office of Environment and Heritage, sea levels in Sydney have risen by around 0.79 meters since 1886. This rate of sea level rise is significantly higher than the global average, which stands at around 0.2 meters per century.
Factors Contributing to Rising Sea Levels in Sydney
Several factors contribute to the rise in sea levels in Sydney, including:
- Thermal expansion: As the planet warms, seawater expands, leading to an increase in sea levels.
- Melting ice caps and glaciers: The melting of polar ice caps and glaciers adds more water to the oceans, further raising sea levels.
- Ocean currents: Changes in ocean currents can also impact sea levels in specific regions, including Sydney.
Impacts of Rising Sea Levels in Sydney
The rising sea levels in Sydney have a wide range of impacts on the city and its residents, including:
- Increased flooding: Low-lying areas in Sydney are at a higher risk of flooding as sea levels continue to rise.
- Beach erosion: Higher sea levels can lead to increased erosion of beaches in Sydney, impacting tourism and coastal ecosystems.
- Infrastructure damage: Buildings and infrastructure along the coast are at risk of damage from rising sea levels and storm surges.
Measuring Sea Levels in Sydney
In order to track the rise in sea levels in Sydney, scientists use a combination of tide gauges and satellite measurements. Tide gauges are instruments that measure the height of the ocean surface relative to a fixed point on land, providing valuable data on sea level trends over time. Satellite measurements, such as those from the European Space Agency’s Sentinel-3 satellite, offer a more comprehensive and global view of sea level rise.
Current Trends and Projections
According to the latest data, sea levels in Sydney are rising at a rate of around 3.2 millimeters per year, with projections indicating that this rate is likely to accelerate in the coming decades. By 2100, sea levels in Sydney could rise by as much as 0.5 meters or more, posing significant challenges for the city and its residents.
Benefits and Practical Tips
Despite the challenges posed by rising sea levels, there are steps that can be taken to mitigate their impacts. Some practical tips for adapting to rising sea levels in Sydney include:
- Elevating buildings and infrastructure in flood-prone areas.
- Implementing coastal protection measures, such as seawalls and dunes.
- Promoting sustainable urban planning and development practices to reduce the city’s vulnerability to sea level rise.
Case Studies
One notable case study of adapting to rising sea levels is the Barangaroo development in Sydney. This waterfront precinct was designed with sea level rise in mind, incorporating elevated buildings and flood protection measures to ensure resilience to future climate impacts.
Firsthand Experience
Residents of Sydney are already feeling the effects of rising sea levels, with increased flooding events and beach erosion becoming more common. By staying informed about sea level trends and taking proactive measures to adapt, residents can help protect their homes and communities from the impacts of rising sea levels.
The measurements of rising sea levels in Sydney paint a clear picture of the challenges that the city faces in the coming years. By understanding the factors contributing to sea level rise, monitoring trends, and taking proactive steps to adapt, Sydney can better prepare for a future where rising sea levels are a reality.
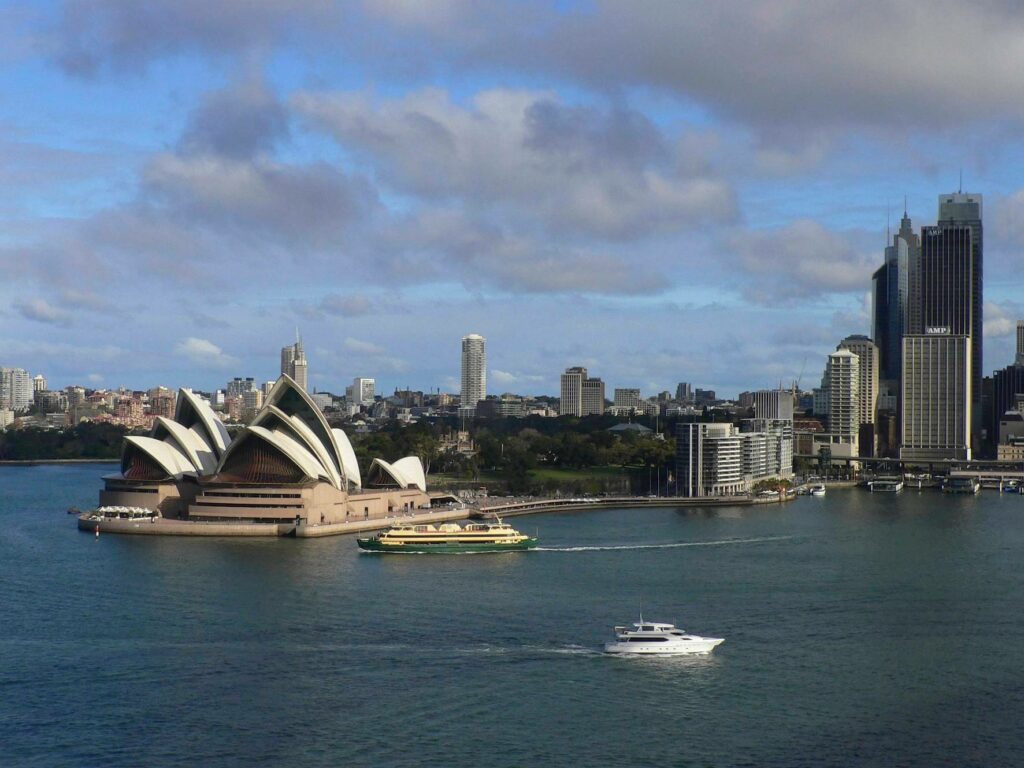
Historical images are frequently used to question human-induced climate change and the associated rise in sea levels. Two pictures of the port of Sydney, Australia are currently being shared on Facebook - one is supposed to be recent, while the other dates back to 1932. The caption sarcastically suggests that this is what a dramatic rise in sea levels looks like, even though there is no visible increase in the photos. Despite being shared thousands of times on various platforms including X, Facebook, and Telegram, these images cannot serve as evidence for whether sea levels are rising in Sydney or not. To determine this, one must rely on actual measurement data which indicates that sea levels are indeed rising in Sydney.
A Facebook post implies that two photos suggest there has been no rise in sea levels in Sydney over recent decades. This assertion is inaccurate.
Comparing Two Photos Is Not Proof of Stable Sea Levels
The black and white photo featured at the top of these posts does indeed date back to 1932. Through a reverse image search, we discovered that it can be found in an online archive maintained by the National Library of Australia. The picture was taken from North Sydney on March 19th, 1932 and shows the newly opened Harbor Bridge without the iconic Opera House which was not constructed until starting in 1959.
The photo labeled as “current” at the bottom of these posts is circulating with a misleading title considering its age according to sources.<i class Reverse Image Search has been available on the internet since at least 2013, although the exact date of its inception is unknown. It remains unclear whether the photos were taken during low tide or high tide.
Even if photos were taken at the same time under identical atmospheric conditions, they are deemed unreliable as evidence, as explained to us by Kristina Hill, a professor at the University of California, Berkeley, during a previous fact-check. She likened it to showing two nighttime photos as proof that the sun never rises.
Data Confirms Rising Sea Levels in Sydney Harbor
According to a report from the German Climate Consortium, sea levels globally are not rising uniformly like water in a bathtub. Satellite observations reveal significant regional disparities in sea level rise. Therefore, assessing local risks depends not only on global trends but also on regional variations in sea level rise.
Researchers rely on data from measurement stations rather than analyzing individual images. These data confirm an increase in sea levels in Sydney Harbor.
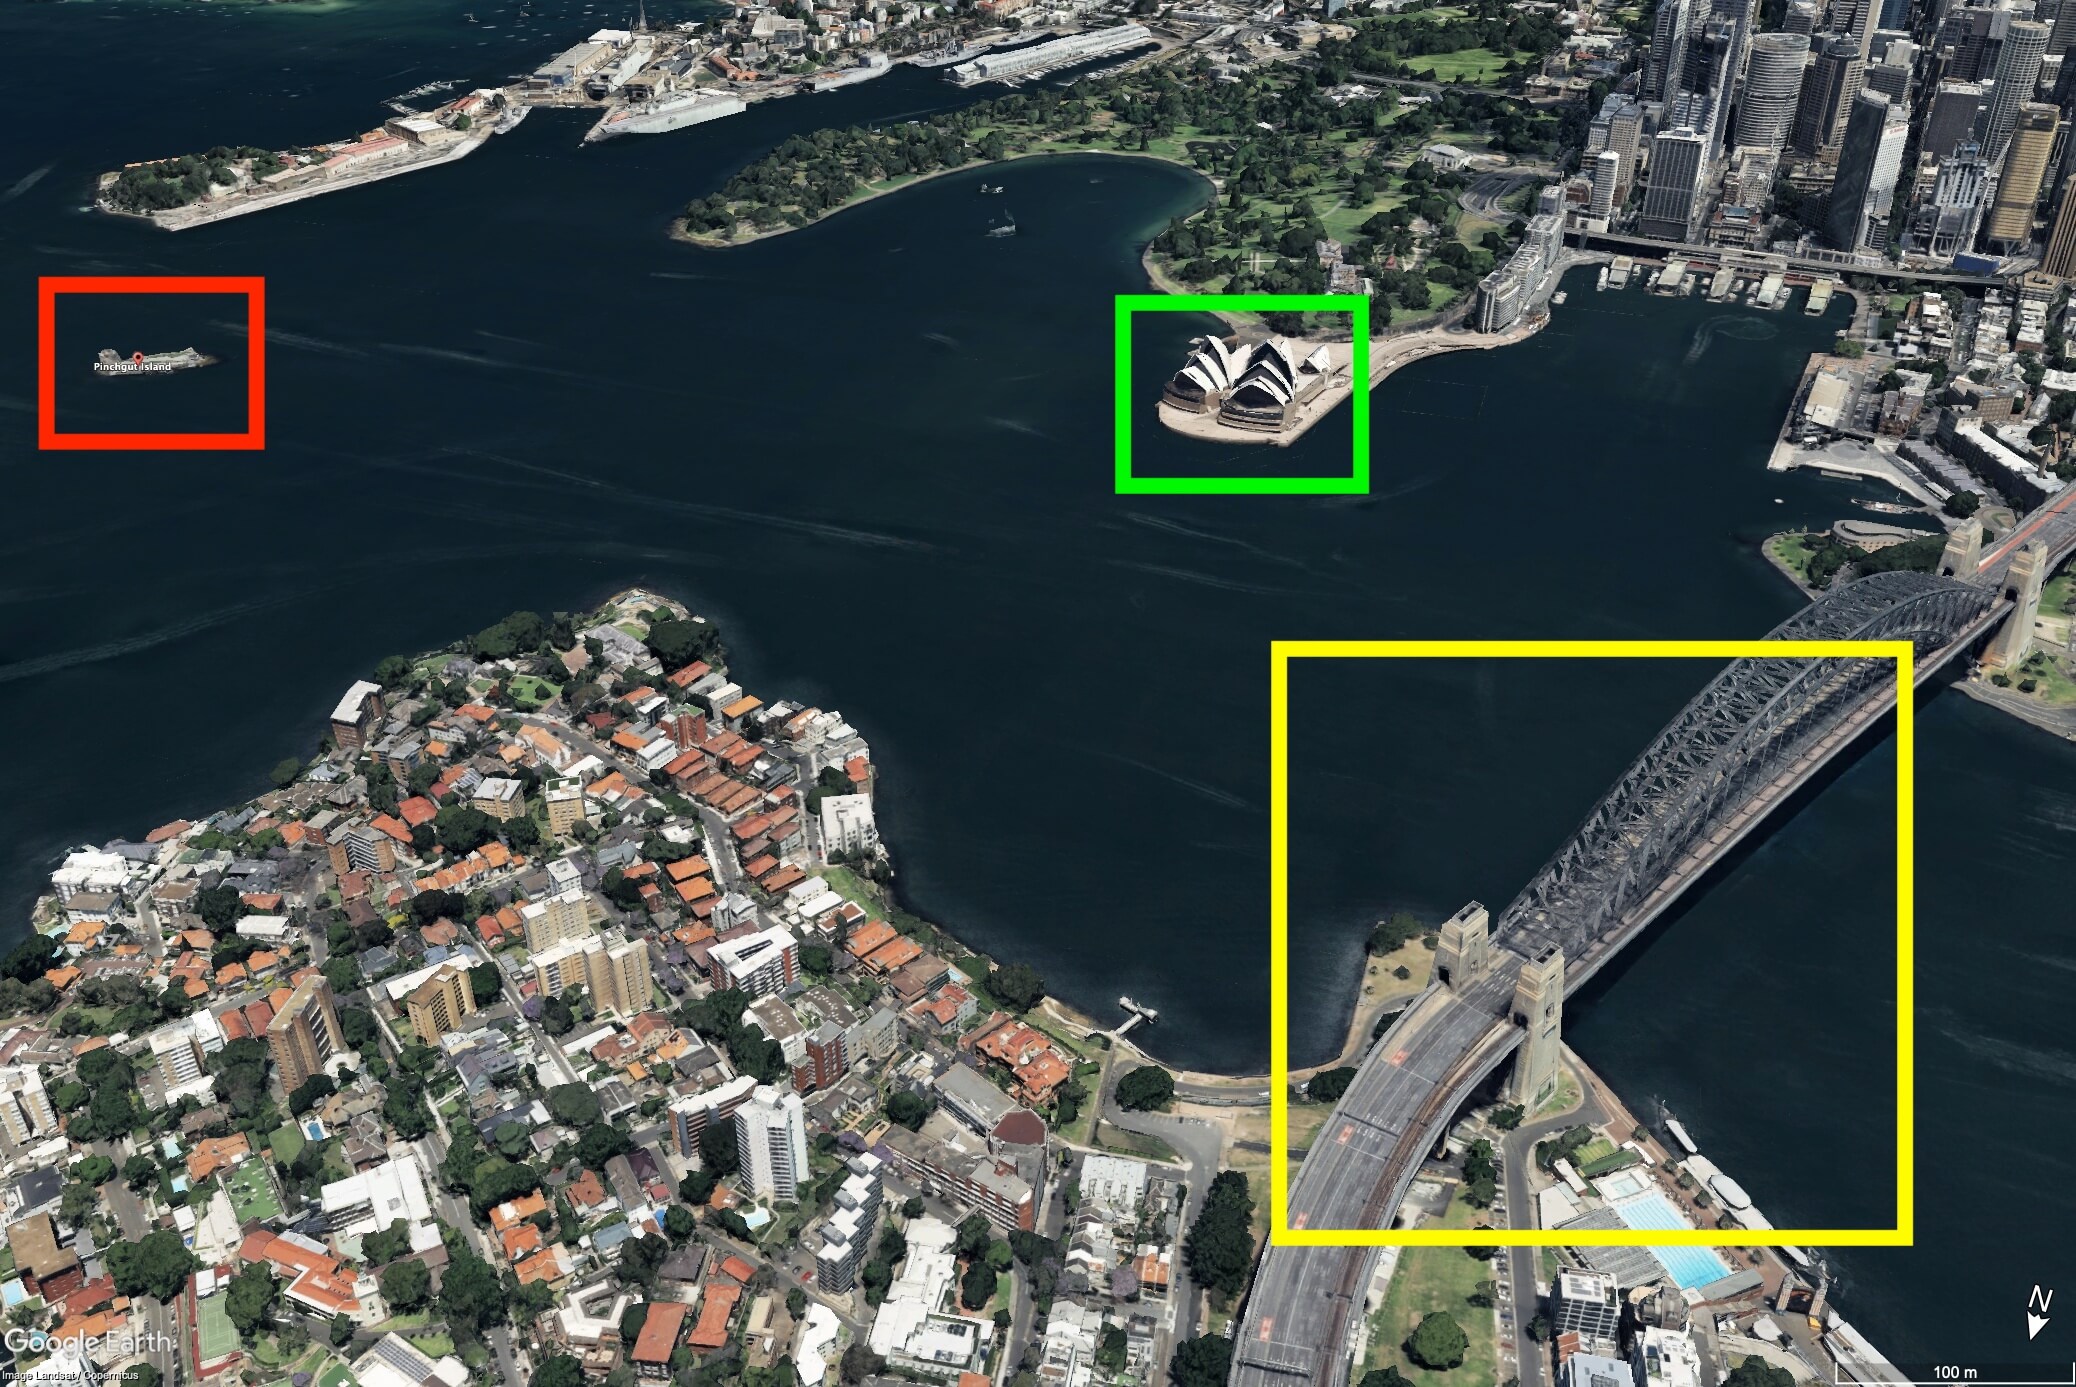
Data from Fort Denison (highlighted in red) confirms rising sea levels in Sydney Harbor. The bridge (highlighted in yellow) and Opera House (highlighted in green), often seen online posts, are located nearby. (Source: Google Earth Pro; Screenshot and Annotations: CORRECTIV.Faktencheck)
In Sydney Harbor, two stations measure—The Rising Sea Levels: A Century-Long Phenomenon
In the heart of Sydney lies Fort Denison, a small island known by various names like Mattewanye, Muddawahnyuh, or Pinchgut Island. For over a century, this island has been witnessing a gradual increase in sea levels. Data analyzed by the National Oceanic and Atmospheric Administration (NOAA) reveals a consistent rise in sea levels over the decades.
Analyzing data from 1886 to 2022, NOAA’s evaluation shows that sea levels have risen approximately 8 centimeters in one hundred years. This equates to an annual relative increase of 0.8 millimeters after adjusting for seasonal variations caused by different temperatures, salinity levels, winds, atmospheric pressures, and ocean currents.
Comparatively, according to a report by the European Environment Agency (EEA), this local rise is lower than the global average increase that stood at an average of 1.7 millimeters per year and totaled 21 centimeters from 1900 to 2020. Since the 1990s, there has been an even faster escalation in sea levels globally attributed mainly to human activities.
As our planet grapples with environmental challenges such as climate change and its impacts on rising sea levels, it becomes increasingly crucial for us as stewards of Earth to address these issues proactively through sustainable practices and policies.